Facilities
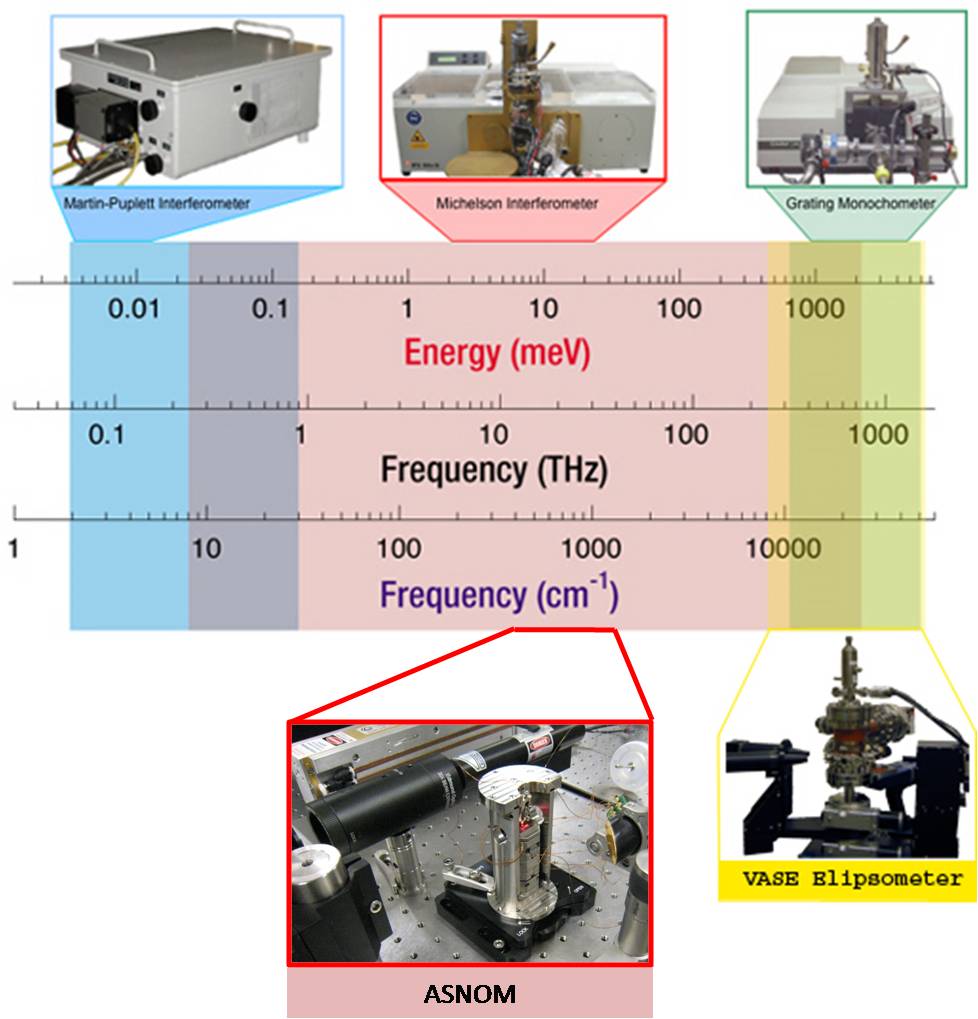
The energy scale depicts the operating range for each spectrometer. All instruments are capable of sample characterization from liquid helium temperatures to room temperature. Please scroll down to read more about each instrument.
Fourier Transform Spectroscopy
A Fourier transform spectrometer is a Michelson interferometer, invented by Albert A. Michelson in 1880, which utilizes a movable mirror and a broad-band source. With this instrument, Michelson conceived the basic techniques of Fourier transform spectroscopy. He measured intensity levels by eye and made crude estimates of the spectrum of the Zeeman effect. To compute Fourier transforms, he invented a mechanical sine and cosine analog computer, which could handle about 80 data points. Using the techniques available to him, Michelson resolved several spectra, which were doublets.
The main component in the Fourier Transform Infrared spectrometer is an interferometer. This device splits and recombines a beam of light such that the recombined beam produces a wavelength-dependent interference pattern or an interferogram. The Michelson interferometer is most commonly used.
A Michelson interferometer consists of two mirrors and a beamsplitter positioned at an angle of 45 degrees to the mirrors. A KBr beamsplitter coated with Germanium is typically used for mid IR region and Mylar for the far-infrared (terahertz) region. Incident light strikes the beamsplitter so that half of the light is transmitted through the beamsplitter and half is reflected to the mirrors. The two components are then reflected back and recombined at the beamsplitter with half of the light passing on toward the sampling areas and half traveling back toward the source. The signal at the detector is a cosine wave. In general, the function of the interferometer is to disperse the radiation provided by the IR source into its component frequencies. With polychromatic light (radiation with more than a single wavelength), the output signal is the sum of all the cosine waves which is the Fourier Transform of the spectrum or an interferogram. The interferogram contains the basic information on frequencies and intensities characteristic of a spectrum but in a form that is not directly interpretable. Thus, the information is converted to a more familiar form, a spectrum, using Fourier Transform methods.
Grating Spectrometer
Martin-Puplett
Specially designed to operate in the near-millimeter and far-infrared region of the frequency spectrum. One of the most important features of these instruments is the inclusion of polarizing grid beam-splitters. The efficiency of the grid beam-splitters is close to 100% for all wavelengths up to the cutoff determined by the grid separation (4�m). The polarizer is used both as a polarizer and as analyzing chopper.
The instrument operates under vacuum to avoid water vapor absorption and microphonism. The optics platform is “floating” inside the vacuum box to avoid changes in alignment. The standard light source is a high pressure mercury lamp with a DC stabilized power supply.
A unique capability of our instrument is the ability to perform absolute measurements over temperatures from liquid helium to room temperature. Additionally characterization of micron sized samples is possible.
NIR-Visible Variable Angle Spectroscpic Ellipsometry (VASE)
Ellipsometry is a technique whereby the amplitude and phase of the reflected light can be measured simultaneous. This powerful tool was originally invented by Paul Drude in 1887, which utilizes a two polarizers to measure the complex ratio of light reflected normal to and in the plane of incidence. Drude was interested in examing the optical properties of materials to test his classical theory of electron dynamics in solids. He not only derived the equations of ellipsometry, but carried out the first measurements on a number of transparent and opaque materials.
Since the days of Drude ellipsometry has become a powerful tool for accurately measuring the optical constants in a timely manner.The technique currently used was originally developed by Aspnes in 1975. He initially followed a similar procude as Drude. Specifically light from a monochrometer is sent through a polarizer fixed at fourty five degrees from the plane of incidence. This light is then reflected at a large angle of incidence from the sample. The reflected light then passes through another polarizer (the analyzer), and finally is focused onto the detector. Aspnes realized that by rotating the analyzer while the polarizer remained fixed, the signal would be modulated and therefore the optical constants could be determined from the phase and amplitude of the detector signal. This technique has since seen some mild improvements including the incorporation of a “compensator”. This element delays the phase of one polarization with respect to another, resulting in circularly polarized light. By combining a rotatable compensator and a rotatable polarizer and elliptical polarization can be attained, allowing one to measure the optical constant with extreme accuracy.
Besides allowing one to measure the phase as well as the amplitude of the reflected wave, Ellipsometry is also an extremely surface sensitive technique. Therefore it is often used to determine structural information of multilayered samples, as well as the quality of interface between two materials. However this also means that measurements at low temperatures must be performed under Ultra-High Vacuum(UHV). We have designed and implemented a UHV chamber as an addition to our commercial VASE that allows us to make measurements from 30-400K at pressures as low as 1.4*10^-10 mBarr.
s-SNOM
Principle:
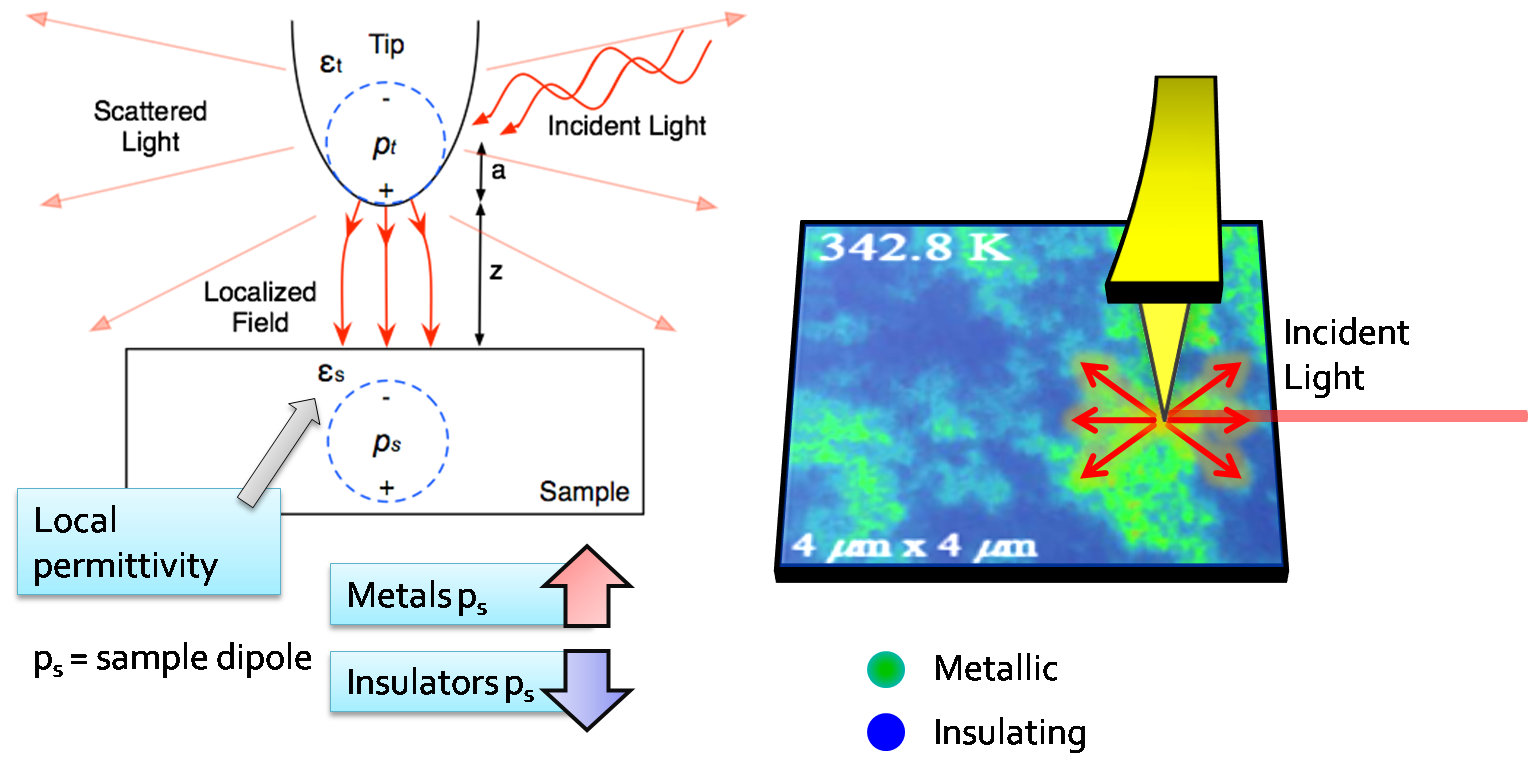
The lighting rod effect of a sharp metallic tip concentrates the incident IR radiation to a volume of roughly ~a^3, where a is the tip’s radius of curvature [Figure below]. The radius of curvature for a commercial metallized AFM tip can be as small as ~10nm. Due to the lightning rod effect being wavelength independent the sharpness of the tip sets the fundamental resolution limit rather than the wavelength. Various incarnations of the s-SNOM have demonstrated ~10-100nm resolution for wavelengths ranging from visible all the way to microwave [2,3,4]. s-SNOM images exhibit wavelength dependent contrast which allows for material identification much in the same way that an FTIR spectrum does. The origin of the contrast at such small lengthscales is most simply explained by a model where the tip and sample interact through dipole-dipole near fields. A sample having a strong resonance (for instance SiC at ~930cm-1) can have a large dipole induced under the tip. Resonant enhancement of the scattered light has been demonstrated for SiC to exceed the scattering from even a perfect conductor such as Gold [2]. Non-resonant contrast is also observed between metallic and insulating regions such as the metal to insulator transition in VO2 [1, Figure below]
.
Neaspec sSNOM:
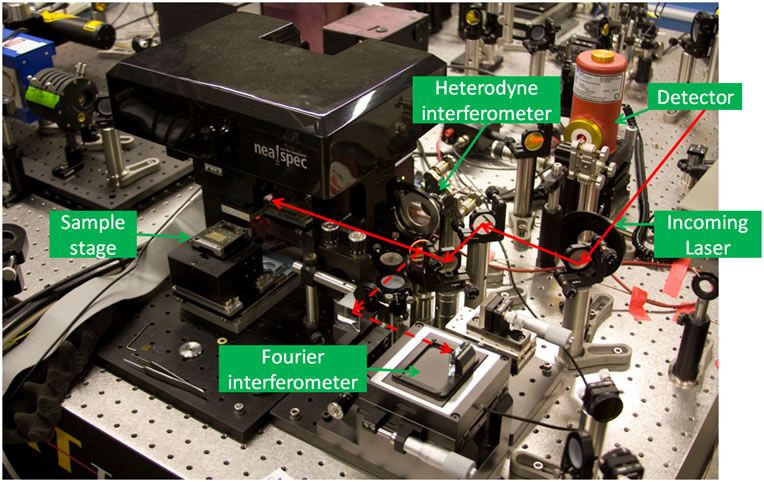
Neaspec sSNOM is a commercial sSNOM presented by Neaspec GmbH in Germany. The image below shows our Neaspec system setup that allows infrared nano-imaging and nanoscopy with either single-frequency lasers (with heterodyne inteferometer) or broadband source (with Fourier inteferometer).
Infrared Sources:
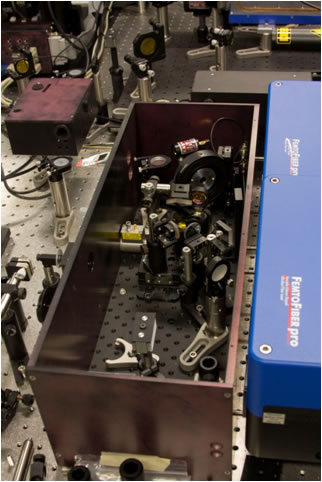
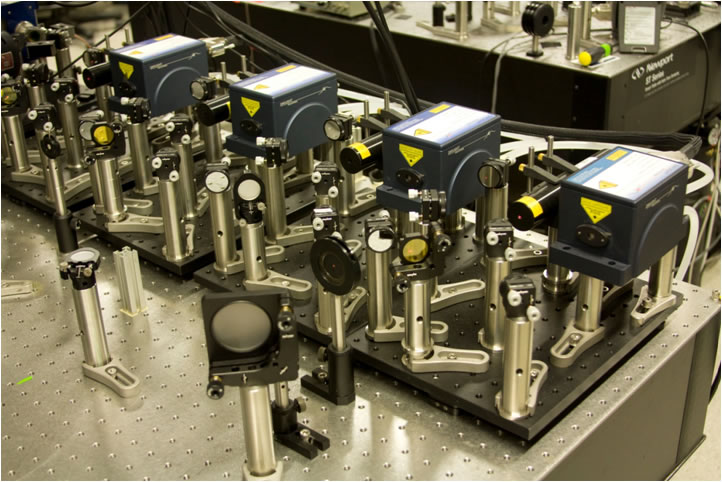
Our infrared sources for the s-SNOM system include broadband laser source (left image below) and QCL laser sources (right image below). The broadband infrared source covers frequency range from 750-2200 cm-1 that is perfect for infrared nanoscopy. While the QCL lasers offer powerful (>100 mW) laser output that is perfect for infrared nano-imaging. The center frequencies of the four QCL lasers shown below are 1120, 2200, 1600, and 1200 cm-1 (from left to right), and their bandwidths are around 100 cm-1. The broadband infrared source and the QCL lasers allow us to explore wide range of fundamental electronic and optical phenomena such as metal-insulator transition of transition metals, surface optical phonon of polar dielectric material, surface plasmon of graphene, etc.
References:
1. Z. Fei, G. O. Andreev, W. Bao, L. M. Zhang, A.S.McLeod, C. Wang, Z. Zhao, G. Dominguez, M. Thiemens, M. M. Fogler, M. Tauber, A. Castro-Neto, C. N. Lau, F. Keilmann, D. N. Basov. “Infrared Nanoscopy of Dirac Plasmons at the Graphene-SiO2 interface” Nano Lett. 11(11), 4701-4705 (2011). PDF
2. Qazilbash, M.M., et al., Mott Transition in VO2 Revealed by Infrared Spectroscopy and Nano-Imaging. Science, 2007. 318(5857): p. 1750-1753. link
3. Hillenbrand, R., T. Taubner, and F. Keilmann, Phonon-enhanced light-matter interaction at the nanometre scale. Nature, 2002. 418(6894): p. 159-162. link
4. Hillenbrand, R. and F. Keilmann, Material-specific mapping of metal/semiconductor/dielectric nanosystems at 10 nm resolution by backscattering near-field optical microscopy. Applied Physics Letters, 2002. 80(1): p. 25-27. link
5. Knoll, B., et al., Contrast of microwave near-field microscopy. Applied Physics Letters, 1997. 70(20): p. 2667-2669. link
Magneto-Optics
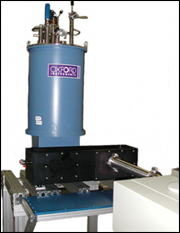 The system is capable of broadband frequency domain spectroscopy in the range 180GHz to 750THz at cryogenic temperatures. The reflection unit (black box on right) couples both the Martin-Puplett and the Michelson interferrometer interferometers (depicted above) to a 9 Tesla superconducting split coil magnet. Additionaly the unit is designed to work with various detectors, including thermal bolometers and semiconducting detectors. The optical layout utilizes an intermediate focus while preserving optical f/#’s throughout enabling DC magnetic field measurements of small crystals with polarized light in both Voight and Faraday geometries. For transparent samples, simultaneous reflection and transmission can be performed.